Dashboard is an analytical tool that helps you keep control of what matters the most at a glance. No matter what metrics you need to keep an eye on - from number of unanswered messages to percentage of monthly target sales - you can put all of them in one place with a few clicks.
In this article, you will be learning about:
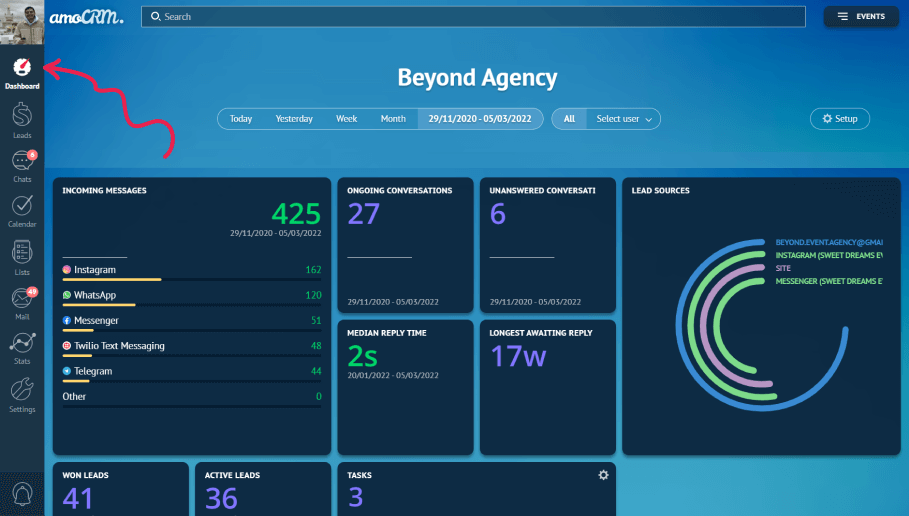
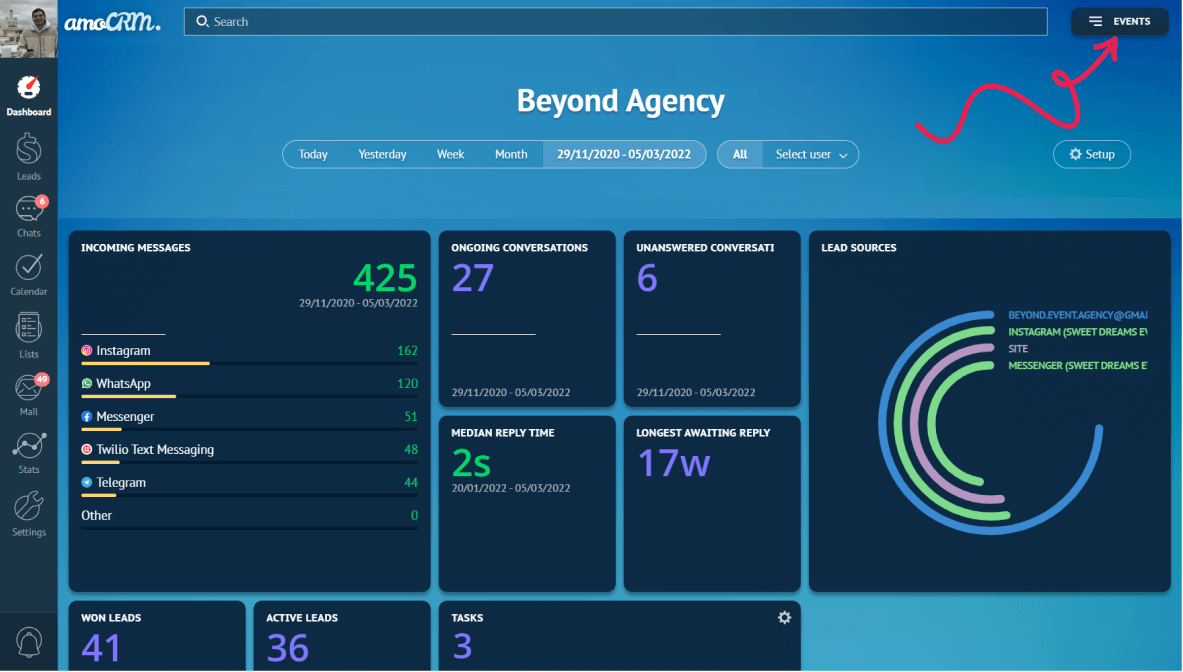
Our dashboard is super flexible, easy to work with and pleasant to look at. You can find it by clicking on the ‘Dashboard’ icon on the top left corner of the menu window.
Overview
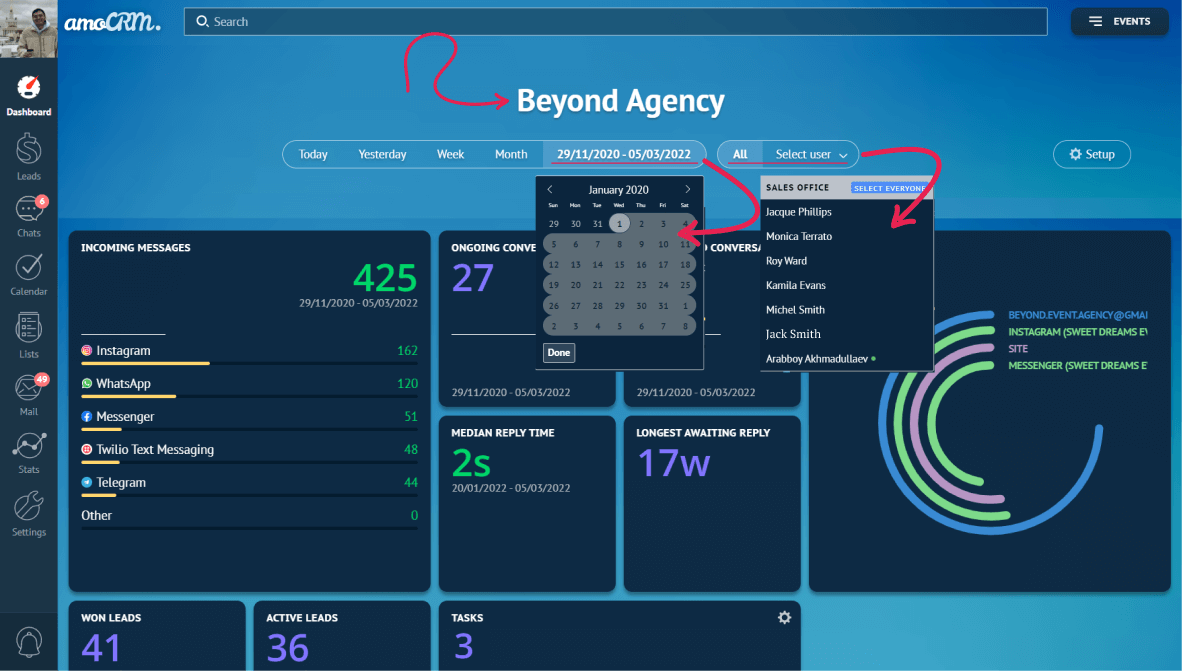
When you access the dashboard, you will see the name of your profile in the upper middle of the window. Just below it there is a timeframe where you can choose what time period should apply for the information on the widgets.
You have options of Today, Yesterday, Week, Month and a custom time frame that can be customized to any time period you want. According to the interval you choose, statistics will change.
You can also choose to see results for all users or select several.
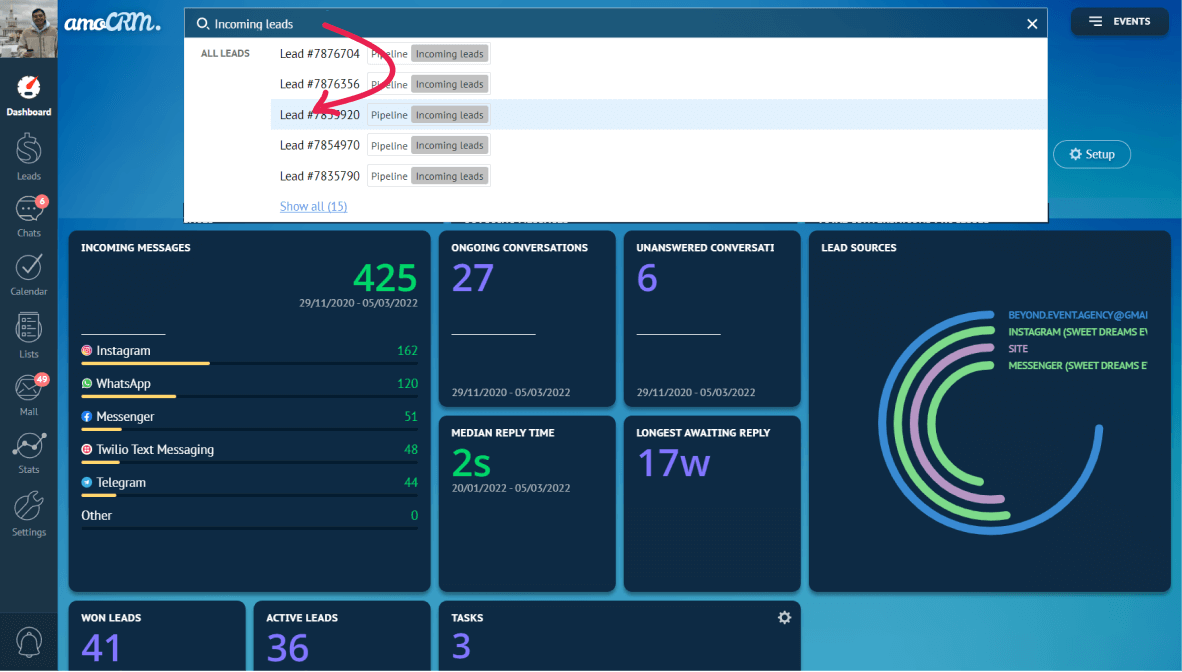
On the very top of the window you can see a search field, which lets you look for information through the whole profile. Go to those pages by just clicking on the results of the search.
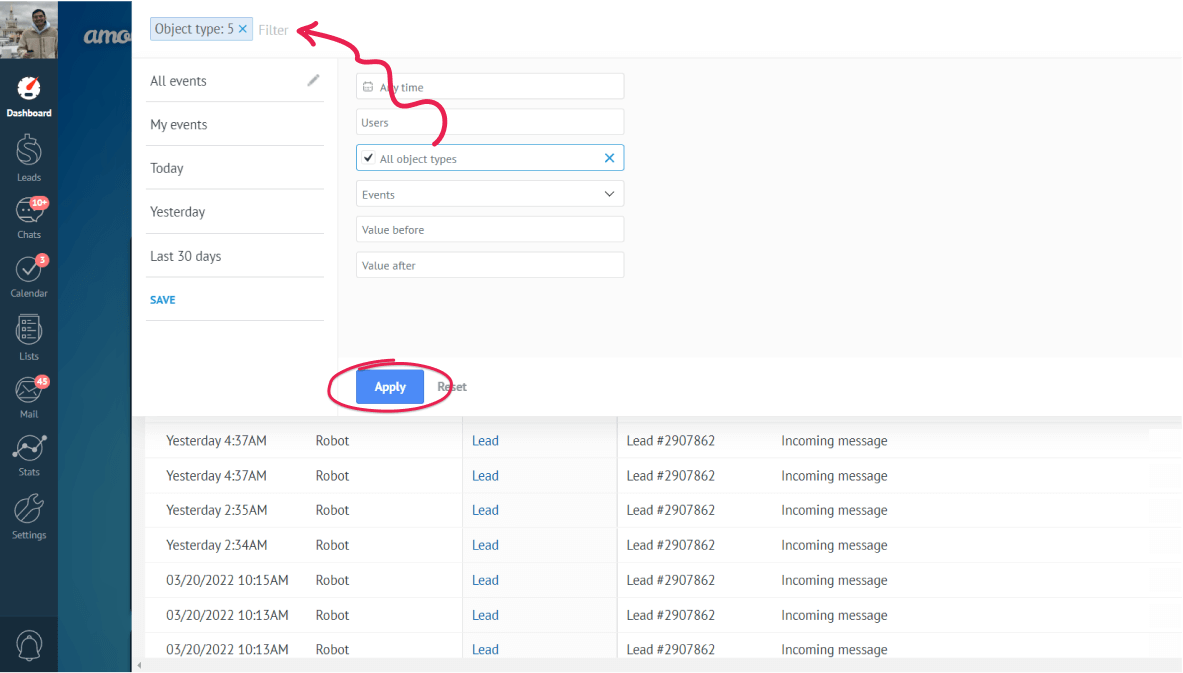
Next to the search field is the Events panel. Click the button to see the recent activity on your account. You can filter them by hitting on the search field.
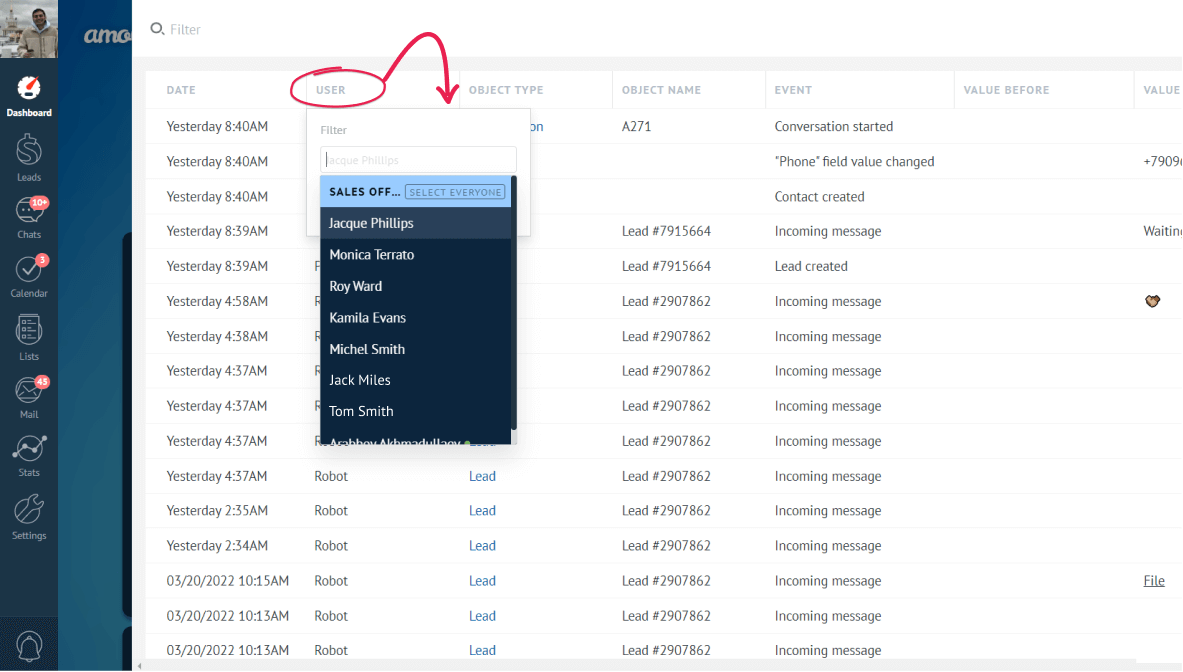
Or, by clicking on the name of any category of the table.
Customization
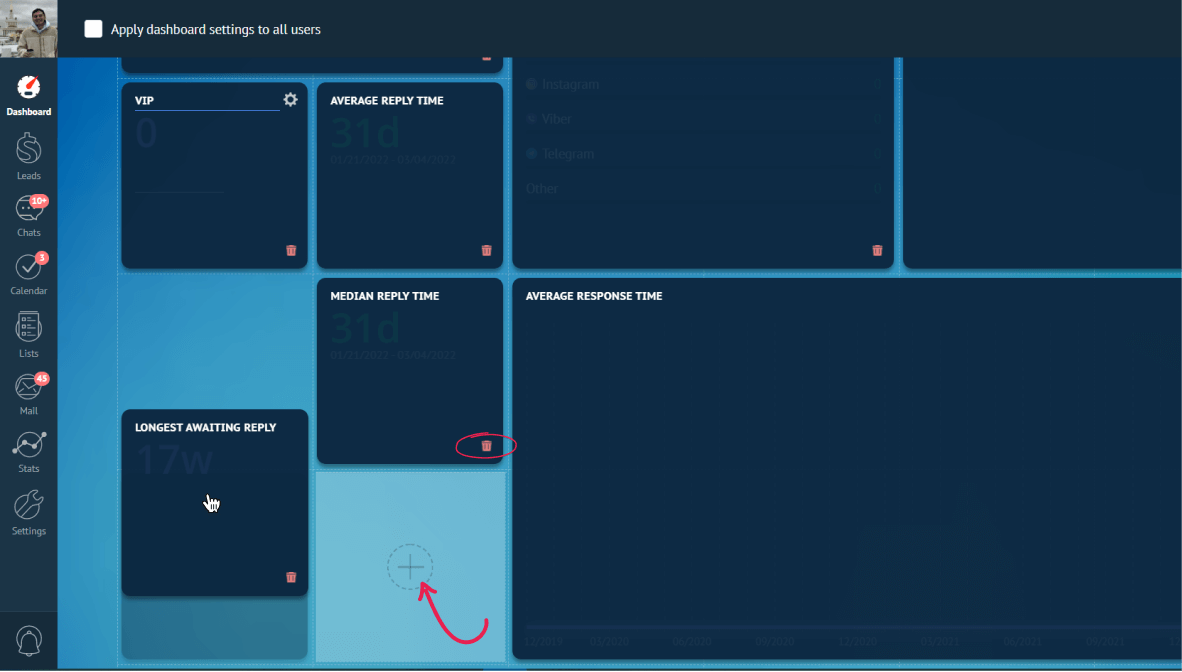
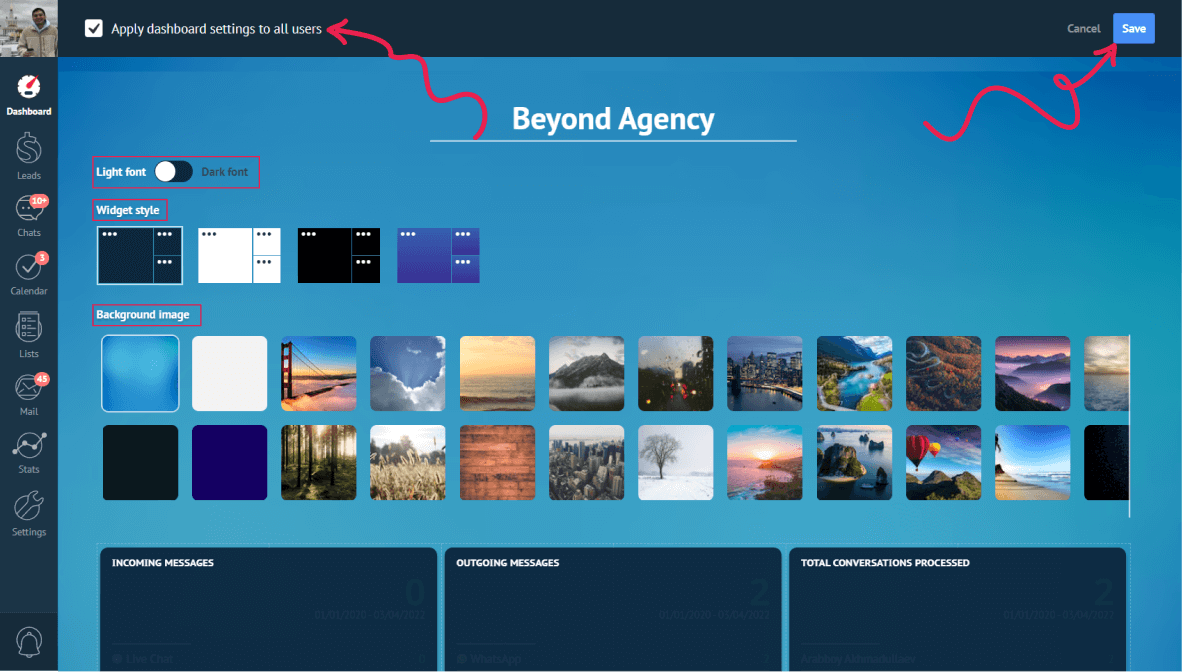
To configure the dashboard, click the Setup button in the upper right corner.
Here you can add prebuilt widgets by clicking any empty space or delete those you do not need or by clicking the threshold. To change the place of the widget just drag it where it needs to be.
Within the setup view, you can also choose the font color, change the background picture and apply color themes.
An account user with admin rights can also apply dashboard settings to all other users by checking the checkbox that will appear at the top of the dashboard setup. Once finished, click save in the upper right.
These options will make the dashboard easier to work with.
Essential widgets
Widgets are very simple and easy to understand. On your preset dashboard we gathered essential widgets that will keep you updated with your messenger based sales! Let’s take a look at them.
Incoming messages
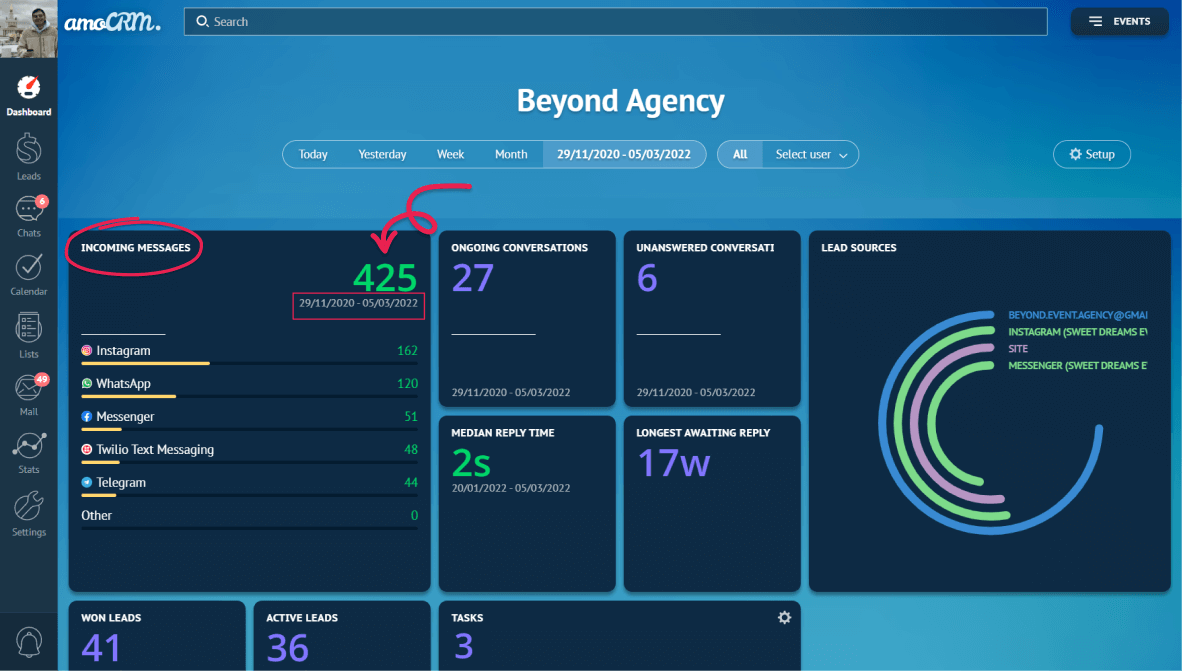
Incoming messages widget keeps track of connected channel usage. It will help you to figure out what channels your team uses the most and what you can get rid of.
On the upper-right side of the widget you can see the overall number of messages received for any given period. The interval of time can also be seen just beneath the incoming messages.
Conversation widgets
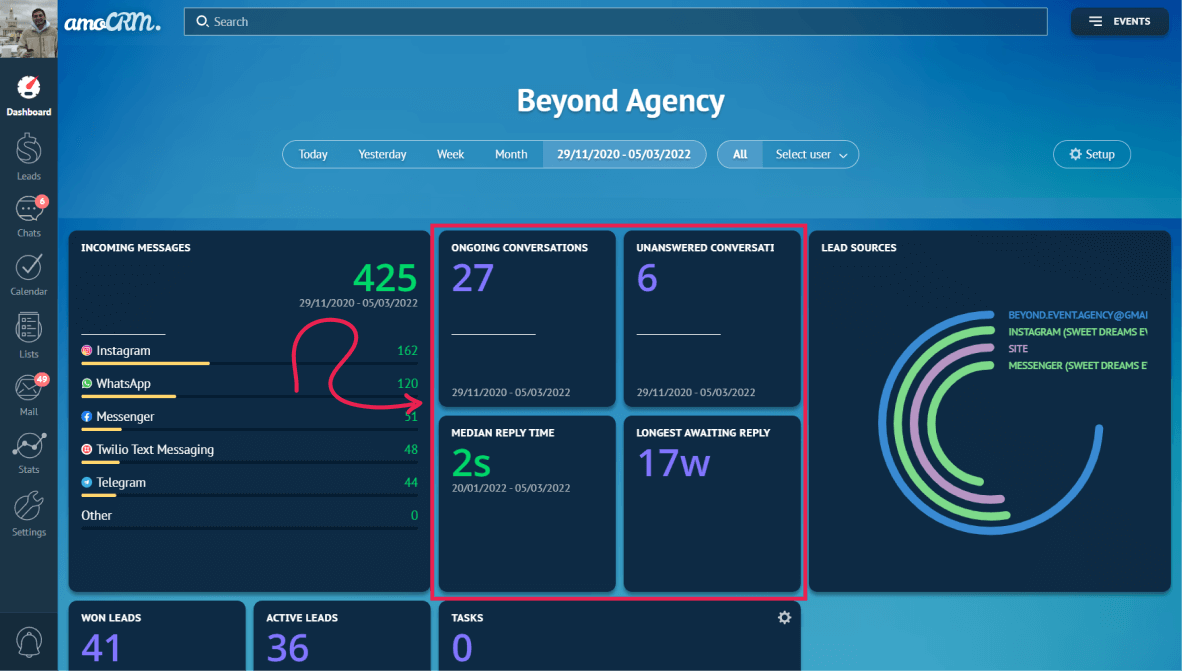
We have 4 widgets that will help you keep track of how well your chats are handled:
- Ongoing conversions - this one will always know how many clients need your attention right now. The conversation is considered ongoing until you click “close conversation”.
- Unanswered conversations - this one will show how many clients have not got your answer yet. The conversation is considered to be unanswered if the last message of conversation was incoming and you have not closed the conversation manually.
- Median reply time - shows you the median time you need to answer incoming messages.
Quick tip: ‘Median’ is the ‘middle’ value in the list of numbers. We prefer to use median instead of average, because average also counts nights and weekends, so your reply time will be larger and does not show how well you’re doing.
- Longest awaiting reply - lets you know how long the client has been waiting and who waits the most.
All of them are real-time widgets, they show you data only for the moment you look at it and do not change their data if you change the time period for the whole dashboard.
Lead sources widget
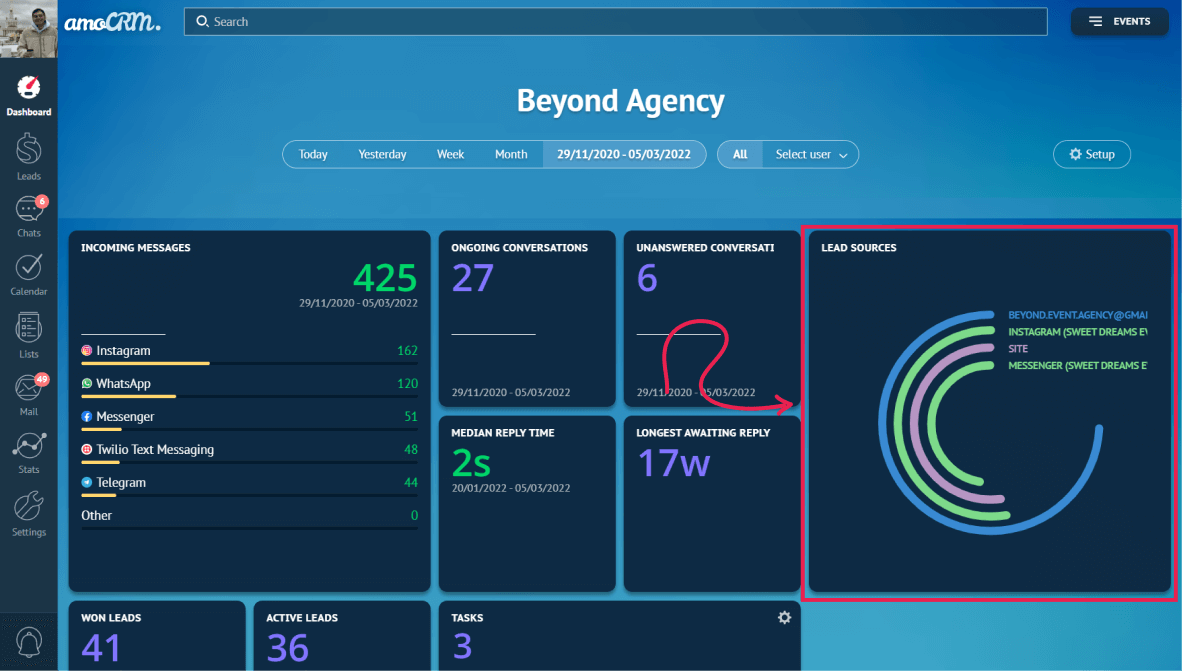
Unlike the Incoming messages widget this one shows the sources of your incoming leads. The lead source with the highest number of incoming leads is shown with the longest bar and the other lead sources are compared to it.
This graph can be different depending on what lead’s sources - from chats to webforms - you are connected to.
Leads widgets
We have 4 basic leads related widgets:
- Won leads - this one shows how many leads you or your team put to the won stage for the chosen period;
- Active leads - this one shows how many leads you have on your active stages of the pipeline;
- Lost leads - counts all leads sent to “Lost”;
- Leads without task - shows how many leads you have with no task assigned.
They are all interactive - you can see the list of the Leads by just hitting the number representing the exact type of leads. For example, when I click on the number of the ‘Won leads’, I will be directed to the ‘Leads’ section with the list of the Leads I want to see.
Tasks widget
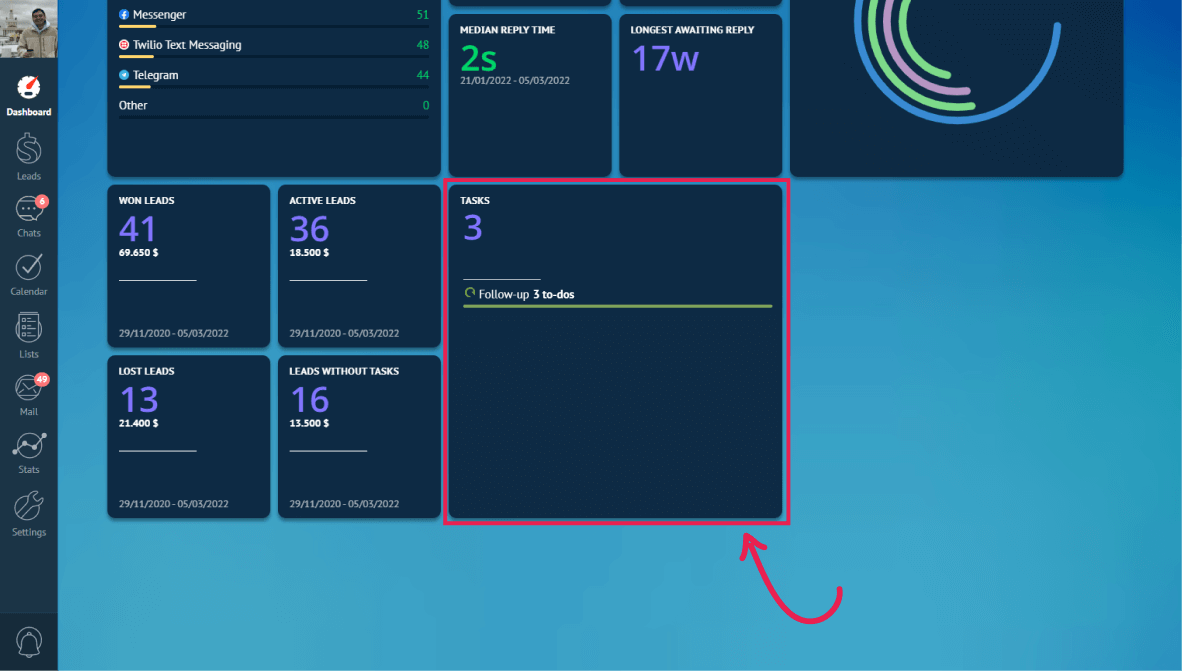
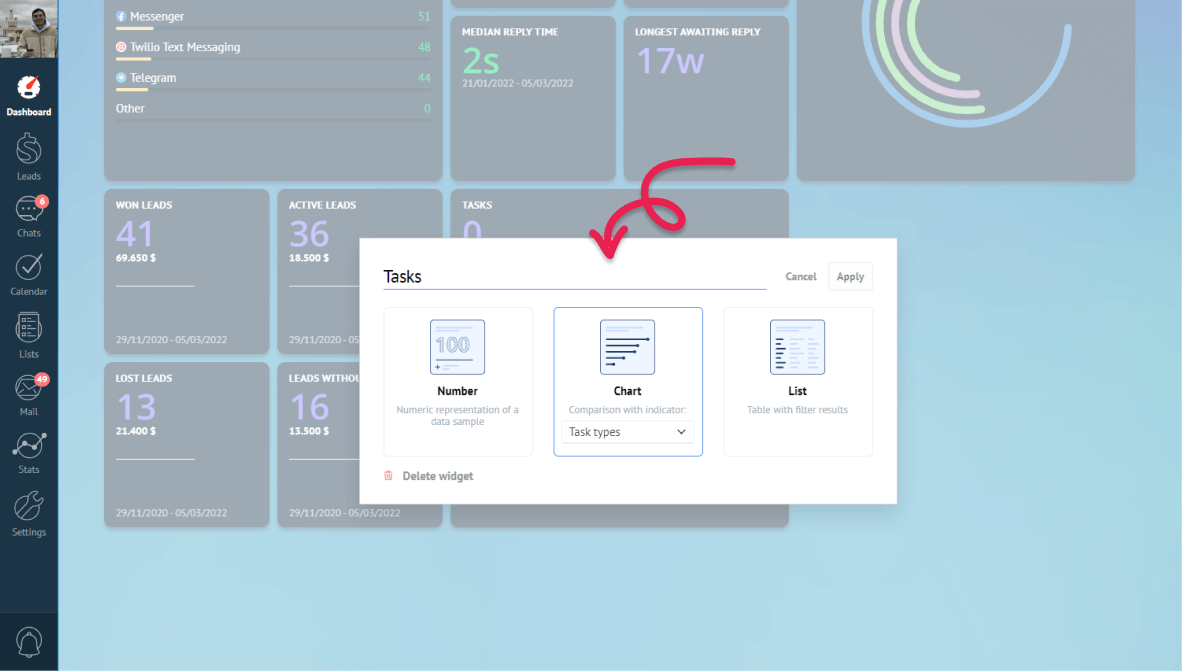
Here, you can see the number of your tasks. By clicking them you can go to the task page. This widget is also customizable, so you can have data represented in a number format, a list or a chart.
You want to learn more about dashboard widgets? Then, you should read our article on Dashboard Widgets - Advanced.
Need more help in setting up or troubleshooting? Contact us by sending an email to support@kommo.com or write to us on Facebook.
Not a user yet? Visit our tour page or contact us for a demo.
